
Pioneer Anomaly Animation
Pioneer Problem Solution - based on RST
Pioneer Problem Reason - caused by SRT
Part 2:
Animation for the Solution of the famous Pioneer Anomaly Problem.
For those readers who are interested to find out more about this interesting Phenomenon I will explain the animation in form of a Quiz. The animation shows, how the Round Trip Time Measurement is found and how it is used to define the various distances to calculate Distance d1.
In addition a second animation coming next will further help to better understand the solution of this famous mystery.
After calling up the animation file do the following:
Run the animation or look at the picture and answer question Q first.
Then look up answer A.
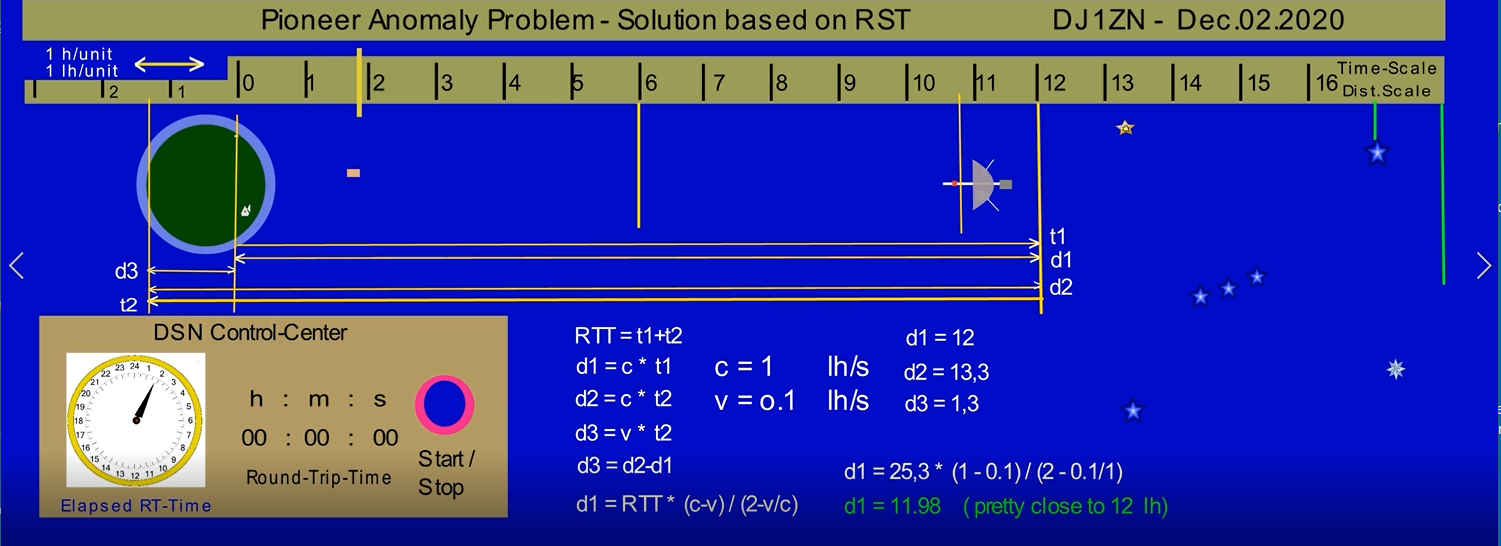
Q1: What does the Picture show at start of the animation?

A1: From top to bottom you see the title bar with the name of the animation and the date of design start. The second bar is a time and velocity bar. Next you see on the left our earth with its surrounding blue atmosphere floating in a dark blue tiny bit of our universe. On the bottom right of Earth is the antenna of the DSN station in Canberra, Australia and a small yellow rectangle, the pulse which will be sent to Pioneer. To the right you see a picture of a Pioneer apace probe. The 4 long horizontal lines are used at the end time of the animation. Below the Earth a yellow rectangle represents the DSN station with its digital clock for precise measurement of the Round Trip Time. The huge analogue clock makes the operators at the coffee table attentive the signal from Earth has arrived. To the right of DSN are measurement results and a list of equations for the calculation of d1, the distance we are looking for.
Q2: Run the animation and stop after about 2 seconds. What has changed?
A2: As already described, the small yellow rectangle representing the signal sent to the Pioneer Probe is now a bit smaller than at start and is at a distance of about 2 lh away from Earth.. This should just indicate the signal will get weaker with time. One remark about the signal: A short signal for example of 1 ms duration will look after it has left its source after1second like the skin of a perfect ball with a diameter of 600 000 km and a thickness of 300 km. Due to the gain of the antenna the amount of energy is most in the direction the antenna is aiming at, in our case towards Pioneer. You also see: due to earth rotation, the DSN station has moved a bit too.
Q3: Start and stop just briefly before 12. What has happened?

A3: The pulse coming from Earth has moved at speed of light towards Pioneer and almost has reached its target. In addition due to its speed of 0.1 c Pioneer has moved 1.2 lh and is now 12 lh away from Earth. The handle of the 24 h clock is now pointing at 12h.
Q4: Stop now a few seconds after 12 and try to find out what the picture looks like now.
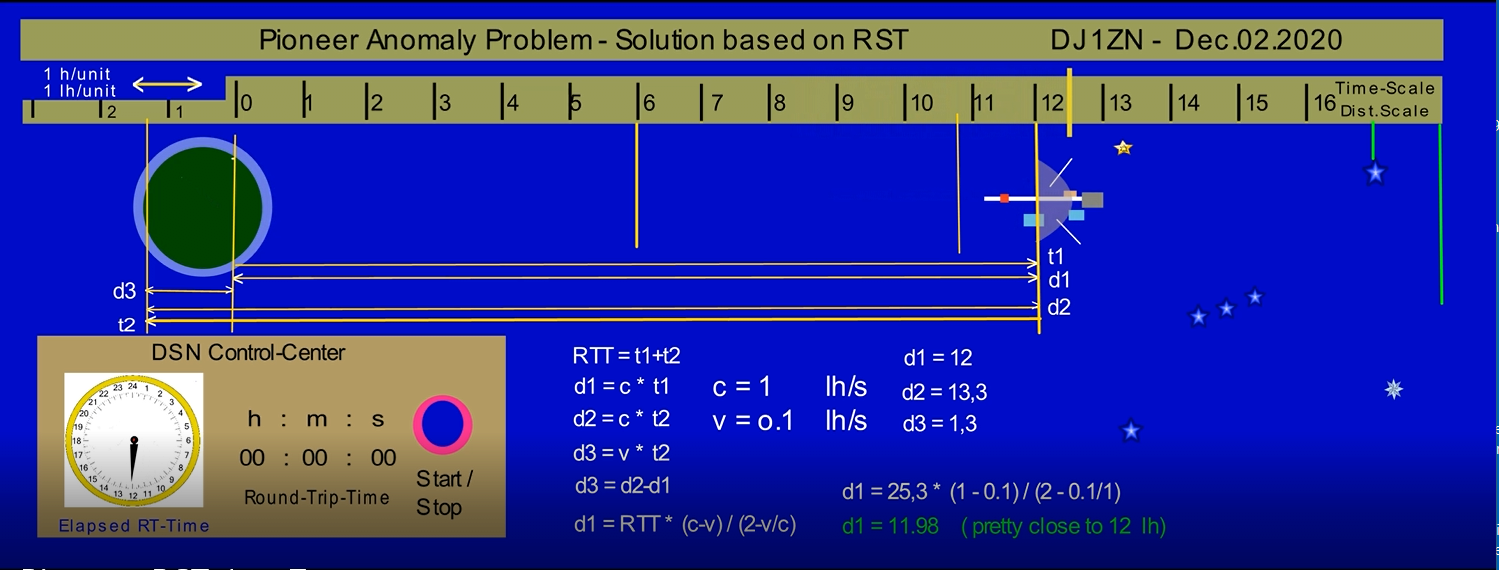
A4: This is probably the most interesting time of the animation and I will describe it in a technical/physical form. In order to indicate this time, I have increased the size of the picture of Pioneer exactly when the pulse arrives. The pulse from Earth –a tiny bit of it- is picked up by Pioneers antenna. The electric signal feeds the amplifier of the receiver. It is converted to a higher frequency, amplified until strong enough to trigger the transmitter to send the signal towards earth via the same antenna. I gave it a form of a blue rectangle. A tiny part moves also in the opposite direction. The DSN clock shows 12o’clock. This is the time at which the pulse is moving towards Earth at speed c with respect o Pioneer. Pioneer is assumed to be resting and the continual increase in distance between Earth and Pioneer is now shown as if the Earth is moving away from Pioneer. It is similar to what astronauts see when they look out of an ISS window. It is quite obvious; Pioneer is the inertial system now. It is impossible on Earth to say, what happens at Pioneer at any time except by observers (if you should see one, shoot a photo and send me a picture – in jpg format please). In just a physical description this chapter would read: The incoming signal from Earth is reflected and sent back to Earth.
Q5: Run the animation again and stop at 18 h. What do you see now?
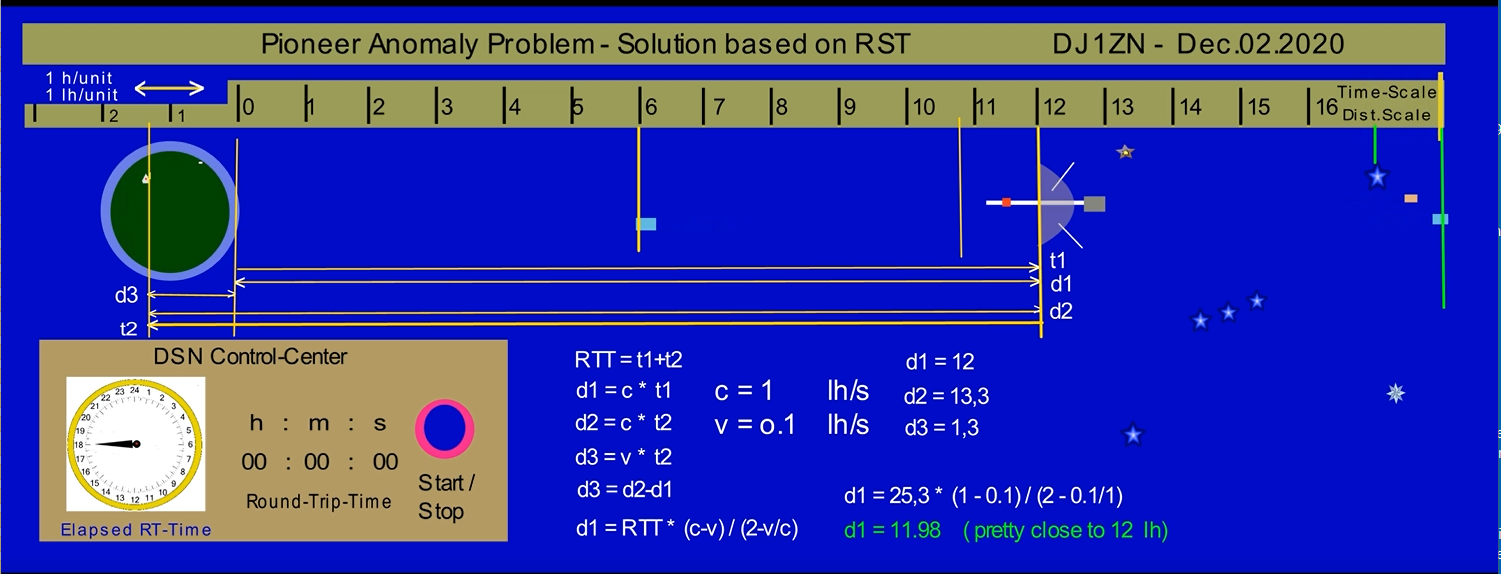
A5: It is an interesting time too, but I will not answer this question.
The animation has ended actually after 25.2 seconds. How would you use the final picture for the calculation of d1?
Q6: Run the animation and wait until it stops automatically after 30 seconds.
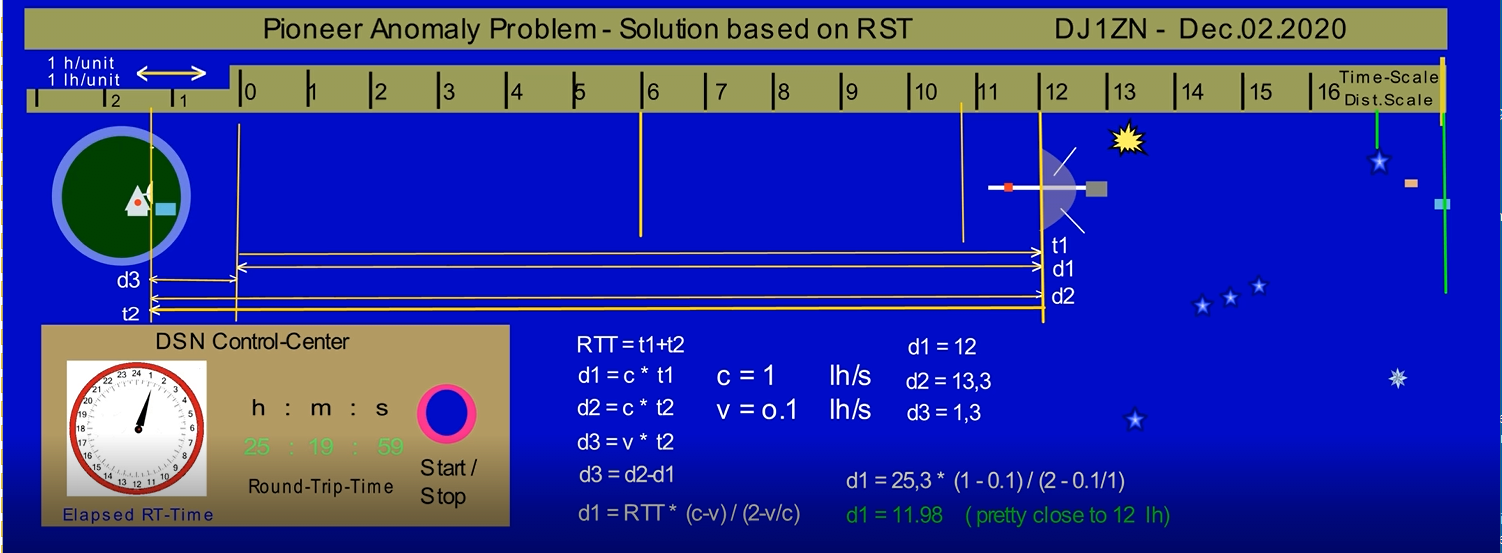
A6: Now we can use the final picture of the animation to find the equation for calculating d1 as a function of the measured Round Trip Time, RTT and the velocity of Pioneer.
I want to repeat: This type of an anomaly would never have been detected without the precise measurements of time and frequencies at the DSN stations.
What we see in the final picture are 4 long and a short horizontal line used to measure distances of Pioneer movement and distances the pulses have travelled at the speed of light with respect to their sources. Lines for time measurement have one arrow at their end. Distance lines have arrows at both ends since is not important from which side a distance between two objects is measured. Here are the results:
t1 is the time it took the measurement pulse to reach Pioneer: t1 = 12 h.
d1 is the distance between Earth and Pioneer at above time: d1 = 12 lh
t2 is the time it took the pulse from Pioneer to reach Earth: t2 = 13.2 h
d2 is the distance between Earth and Pioneer after the pulse has reached Earth. d2 = 13.2 lh
d3 is the distance increase due to the movement of Pioneer away from Earth.
d3 = 1.2
You will probably say Earth does not move. But from Pioneers point of view Earth is moving away according to the Resting Source Theory in use.
The hand of the analogue clock points at 1.2 h. The digital clock shows the measured Round Trip Time RTT. On the right of the DSN Control Centre are all equations required to calculate the distance d1. Since the drawing is designed to scale, the result is correct for a velocity of Pioneer away from Earth at a speed of 0.1c.
Last not least, it is fun to design an animation for an interesting problem like the Pioneer Anomaly Problem.